The Essential Report Archive Read the latest report
-
Federal voting intention
Q. If a Federal Election was held today to which party will you probably give your first preference vote? If not sure, which party are you currently leaning toward? If don’t know – Well which party are you currently leaning to?
Q Total 1 week ago 5 weeks ago Election 29/04/19 08/04/19 02/07/16 Liberal 36% 36% 36% National 2% 4% 3% Total Liberal/National 38% 39% 38% 42.0% Labor 34% 37% 35% 34.7% Greens 12% 9% 11% 10.2% Pauline Hanson’s One Nation 7% 6% 5% Other/Independent 9% 9% 10% 13.1% 2 party preferred Liberal/National 48% 49% 48% 50.4% Labor 52% 51% 52% 49.6% - Respondents who select ‘don’t know’ are not included in the results. The two-party preferred estimate is calculated by distributing the votes of the other parties according to their preferences at the 2016 election.
-
Expected Winner
Q. Which party do you expect will win the 2019 Federal election and form Government?
Total Vote Labor Vote Liberal / National Vote Greens NET: Vote Other Last Week Labor 54% 90% 21% 68% 47% 59% Liberal/National 46% 10% 79% 32% 53% 41% - 54% of voters believe Labor will be victorious over the Liberal/National coalition in the 2019 Federal election, down 5%pts from last week from 59%.
- Expectations among supporters of the Labor party of a Labor win have dropped from 95% last week to 90% this week.
- The majority of Coalition voters (79%, up from 74%) and those intending to vote for another party/independent candidate (53%, no change) expect the Coalition to form Government following the election.
-
Views on Liberal/National Policies
Q. Here are some policies proposed by the Liberal-National Coalition. To what extent do you oppose or support each? NET: Strongly/Somewhat support
Total Vote Labor Vote Liberal / National Vote Greens NET: Vote Other Break up energy companies who are found to be charging too much 72% 66% 76% 72% 78% Establish a new $461 million package to support mental health for young people 68% 68% 69% 73% 66% Investment of $100 million into new infrastructure around Australia 67% 61% 79% 53% 69% Reduce the marginal tax rate on all incomes above $45,000 to 30%, from July 1st, 2024 50% 41% 62% 40% 54% Investigate building a new coal-fired power plant in Queensland 32% 23% 48% 10% 37% Change legislation so doctors have less of a say in the treatment of asylum seekers 28% 17% 42% 9% 38% - The Liberal/National policy to ‘Break up energy companies who are found to be charging too much’ was the most supported of the Liberal/National policies, with 72% of all Australians supporting this. ‘Establish a new $461 million package to support mental health for young people’ and ‘Investment of $100 million into new infrastructure around Australia’ also received support from over half of the population.
- Among their own voters, the most favoured policy was ‘Investment of $100 million into new infrastructure around Australia’, for which 79% of Liberal/National voters supported.
- There was more opposition than support for the policies to ‘Investigate building a new coal-fired power plant in Queensland’ (32% support, 34% oppose) and ‘Change legislation so doctors have less of a say in the treatment of asylum seekers’ (28% support, 34% oppose).
Less than half of Liberal/National voters supported the policies to ‘Investigate building a new coal-fired power plant in Queensland’ (48% support) and ‘Change legislation so doctors have less of a say in the treatment of asylum seekers’ (42% support).
-
Views on Labor Policies
Q. Here are some policies proposed by Labor. To what extent do you oppose or support each? NET: Strongly/Somewhat support
Total Vote Labor Vote Liberal / National Vote Greens NET: Vote Other Extend Medicare to cover cancer and aged dental treatment 76% 83% 68% 85% 82% Waive up-front fees for 100,000 students to enable them to attend TAFE 60% 73% 50% 70% 57% Have a target for at least 50% of Australia’s energy to be generated from renewables by 2030 58% 75% 42% 80% 54% Reverse cuts to penalty rates 50% 66% 36% 60% 49% Introduce a mechanism for First Nations people to have a greater say in policy issues that impact on their lives to parliament, often referred to as an indigenous voice 43% 55% 31% 65% 37% Reduce tax concessions for investors and self-funded retirees 39% 54% 26% 49% 36% - Over three-quarters of people support the Labor policy to ‘Extend Medicare to cover cancer and aged dental treatment’. This was the most supported policy among Labor (83% support), Liberal/National (68%), Greens (85%) and other party/candidate (82%) voters.
- All Labor policies received majority support among Labor voters.
- The policy to ‘Reduce tax concessions for investors and self-funded retirees’ had the lowest support overall, with 39%. 32% of people opposed this policy.
-
Preferred Policy Package
Q. Regardless of your current vote, which one of the two groups of policies do you prefer?
Total Vote Labor Vote Liberal / National Vote Greens NET: Vote Other Liberal/National Package 36% 7% 75% 8% 39% Labor Package 46% 81% 15% 76% 33% Unsure 18% 12% 10% 16% 28% - When asked to make a direct comparison between the policies of both major parties, 46% preferred that offered by the Labor party, compared to 36% for the Coalition.
- 15% of Liberal/National voters said they preferred the policies offered by Labor to those of the party they intend to vote for. 7% of Labor voters said they preferred the Coalition package.
- Respondents aged over 55 were more likely to prefer the Coalition package (43%, compared to 39% for Labor).
-
Election Engagement
Q. How much attention have you been paying to the news, advertising and updates from the Federal Election?
Total Vote Labor Vote Liberal / National Vote Greens NET: Vote Other Last week Have not been paying any attention 16% 14% 10% 17% 21% 19% Have been paying little attention 29% 29% 28% 34% 30% 29% Have been paying some attention 36% 38% 40% 31% 31% 33% Have been paying a lot of attention 19% 19% 21% 18% 19% 20% Total Aged 18-34 Aged 35-54 Aged 55+ Have not been paying any attention 19% 26% 15% 9% Have been paying little attention 29% 32% 33% 23% Have been paying some attention 36% 28% 38% 41% Have been paying a lot of attention 19% 14% 14% 28% - There has been limited change in the interest shown in the election during the past week. 16% (down 3%pts from 19% last week) said they have not been paying any attention to the election. This was highest among those aged 18-34 (26%).
- Engagement in the election was lower among those intending to vote for a minor or independent candidate. 21% of these voters say they haven’t been paying any attention the election.
- Older voters are so far most engaged with the election, with 28% saying they have been paying a lot of attention.
- Men were more likely than women to say they had been paying a lot of attention to the election (24% to 14%).
-
News Stories
Q. What news stories about the campaign have you noticed?
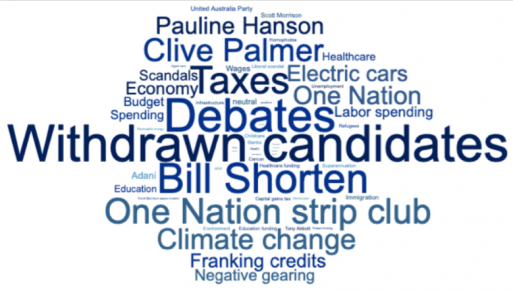
- The withdrawal of candidates was the most mentioned item of news this week, with Liberal candidates Jessica Whelan (Lyons), Peter Killin (Wills) and Jeremy Hearn (Isaacs) all withdrawing. Labor lost candidates – Wayne Kurnorth (NT Senate) and Luke Creasey (Melbourne).
- The leadership debates also received a lot of mentions this week, with a third scheduled for this week.
- The scandal involving One Nation senator Steve Dickson had high awareness, with specific mentions, along with ‘One Nation’ and ‘Pauline Hanson’ both being talked about.
-
Preferred Prime Minister
Q. Who do you think would make the better Prime Minister out of Scott Morrison and Bill Shorten?
Total Vote Labor Vote Lib/Nat Vote Greens Vote other Apr 2019 Mar 2019 Jan 2019 Dec 2018 Nov 2018 Oct 2018 Scott Morrison 42% 13% 80% 13% 42% 40% 44% 42% 40% 41% 42% Bill Shorten 31% 63% 7% 48% 19% 31% 31% 30% 29% 29% 27% Don’t know 27% 25% 12% 40% 39% 29% 26% 28% 31% 29% 31% - 42% thought that Scott Morrison would make the better Prime Minister (up 2%pts from last week), and 31% thought Bill Shorten would be better (no change). 27% did not know who would make a better Prime Minister.
- Greens voters have become more open to the idea of Bill Shorten as Prime Minister this week. 48% of Greens voters said Bill Shorten would make a better PM, up 10%pts from 38% last week. Preference for Scott Morrison has fallen 12%pts from 25% last week to 13% this week.
- The results were split by party allegiance, with 80% of Liberal/National voters saying that Scott Morrison would be a better Prime Minister (up 2% pts from last week), and 63% of Labor voters saying Bill Shorten would (up 1%pt).
- Both men (44% to 35%) and women (40% to 27%) would prefer Scott Morrison to Bill Shorten as Prime Minister.