The Essential Report Archive Read the latest report
-
2019 Voting Method
Q. Which of the following best describes how you intend to vote at the Federal Election?
Total Vote Labor Vote Liberal / National Vote Greens NET: Vote Other Last Week I will vote at a pre-poll before election day 24% 30% 26% 21% 22% 21% I will vote by post 13% 12% 13% 13% 18% 12% I will vote at a polling station on election day 50% 50% 55% 55% 48% 56% I’m not sure how I will vote 9% 7% 5% 5% 7% 7% I don’t intend to vote 3% 1% 1% 1% 3% 3% I intend to vote informal 1% 0% 0% 0% 3% 1% - Half (50%) of voters intend to visit a polling station on election day, with pre-polling the second most popular option, with 24% intending to do this.
- As election day gets closer, fewer people said they intend to vote on the day. Last week 56% intended to vote on election day, this is now 50%, with those intending to pre-poll increasing from 21% to 24%, and voting by post moving from 12% to 13%.
- Voters aged 55 and over are most likely to complete a pre-poll vote before election day (30%).
-
Previous Voting Practice
Q. Which of the following statements best describes how you have voted in previous Federal elections?
Total Vote Labor Vote Liberal / National Vote Greens NET: Vote Other I always vote for a major party (either Labor or Liberal/National) 44% 58% 59% 5% 15% I usually vote for the major parties, but sometimes shift to minor party or independent 36% 35% 36% 36% 37% I usually vote for a minor party or independent but sometimes vote for a major party 13% 6% 3% 40% 30% I always vote for a minor party or independent 7% 2% 1% 20% 18% - 44% of people said they always voted for a major party (either Labor or Liberal/Nationals) and a further 36% say they usually vote for one of these parties.
- Those aged over 55 years are most likely to always vote for a major party (52%).
- 41% of those intending to vote Green at the next election said they always, or usually voted for a major party, 52% of people intending to vote for a minor party (One Nation, UAP etc.) or an independent candidate said they always/usually voted for a major party.
-
Federal voting intention
Q. If a Federal Election was held today to which party will you probably give your first preference vote? If not sure, which party are you currently leaning toward? If don’t know – Well which party are you currently leaning to?
Q Total 3 Weeks ago 5 weeks ago Election 08/04/19 25/03/19 02/07/16 Liberal 36% 36% 35% National 4% 3% 4% Total Liberal/National 39% 38% 39% 42.0% Labor 37% 35% 36% 34.7% Greens 9% 11% 10% 10.2% Pauline Hanson’s One Nation 6% 5% 7% Other/Independent 9% 10% 8% 13.1% 2 party preferred Liberal/National 49% 48% 48% 50.4% Labor 51% 52% 52% 49.6% - Respondents who select ‘don’t know’ are not included in the results. The two-party preferred estimate is calculated by distributing the votes of the other parties according to their preferences at the 2016 election.
-
Expected winner
Q. Which party do you expect will win the 2019 Federal election and form Government?
Total Vote Labor Vote Liberal / National Vote Greens NET: Vote Other Labor 59% 95% 26% 73% 47% Liberal/National 41% 5% 74% 27% 53% - 59% of voters believe Labor will be victorious over the Liberal/National coalition in the 2019 Federal election. Expectations among supporters of the Labor party are high, with 95% believe Labour will win. The majority of Coalition voters (74%) and those intending to vote for another party/independent candidate (53%) expect the Coalition to form Government following the election.
- A majority of both men (60%) and women (58%) expect Labor to win the election.
- Over half of each of the age ranges 18-34 (61%), 35-54 (61%) and 55+ (56%) also expect Labour to form the next Government.
-
2019 election issues
Q. How important are each of the following issues in deciding how you will vote in the next election? 10 – Very Important
Total Vote Labor Vote Liberal / National Vote Greens NET: Vote Other Healthcare 40% 49% 31% 33% 41% National security and terrorism 35% 31% 40% 21% 38% Management of the economy 33% 32% 37% 24% 33% Jobs 31% 38% 25% 20% 35% Education 31% 39% 22% 32% 28% Tax 28% 30% 25% 20% 32% Environment 26% 31% 15% 50% 24% Climate change 26% 31% 16% 50% 19% Immigration 25% 25% 25% 18% 34% Housing 24% 30% 16% 22% 25% Transport and infrastructure 22% 24% 20% 15% 23% - On a 0-10 importance scale, 40% of people said Healthcare was an important issue (giving highest score of 10 out of 10). This was rated as an important issue by just under half of Labor voters (49%) and by the highest proportion of those voting for a minor party or independent (41%).
- 35% thought National security and terrorism was a very important election issue. This result was highest among Coalition voters (40%), where it was the top issue, and those voting for another party or independent (38%).
- The issues given a ‘Very important’ rating by Greens voters were Climate change (50%) and the Environment (50%).
-
Election engagement
Q. How much attention have you been paying to the news, advertising and updates from the Federal Election?
Total Vote Labor Vote Liberal / National Vote Greens NET: Vote Other Have not been paying any attention 19% 14% 12% 15% 19% Have been paying little attention 29% 30% 29% 31% 27% Have been paying some attention 33% 35% 33% 37% 40% Have been paying a lot of attention 20% 21% 27% 17% 14% Total Aged 18-34 Aged 35-54 Aged 55+ Have not been paying any attention 19% 26% 19% 11% Have been paying little attention 29% 34% 31% 21% Have been paying some attention 33% 26% 35% 38% Have been paying a lot of attention 20% 14% 14% 29% - Just under one in five people (19%) say they have not been paying any attention to the election. This was highest among those aged 18-34 (26%).
- Engagement in the election was lower among those intending to vote for a minor or independent candidate. 19% of these voters say they haven’t been paying any attention the election, and just 14% say they have been paying a lot of attention.
- Older voters are so far most engaged with the election, with 29% saying they have been paying a lot of attention.
- Men were more likely than women to say they had been paying a lot of attention to the election (25% to 14%).
-
News stories
Q. What news stories about the campaign have you noticed?
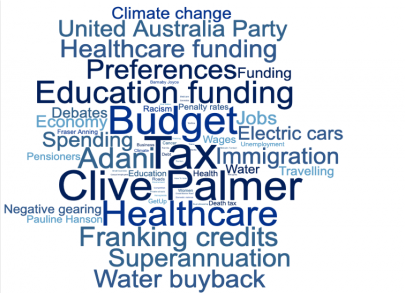
- The preference agreement between the Liberals and UAP has been dominating the news this week. ‘Clive Palmer’, ‘United Australia Party’ and ‘Preferences’ all received a notable number of mentions.
- ‘Tax’ was one of the most mentioned issued participants recall seeing in the news this week, along with continuing topics relating to the Budget announcement made earlier in the month.
- ‘Healthcare’ and ‘Healthcare funding’ have been one of the most noticed policy topics over the past week.
-
Preferred Prime Minister
Q. Who do you think would make the better Prime Minister out of Scott Morrison and Bill Shorten?
Total Vote Labor Vote Lib/Nat Vote Greens Vote other Mar 2019 Jan 2019 Dec 2018 Nov 2018 Oct 2018 Sep 2018 Scott Morrison 40% 10% 78% 25% 44% 44% 42% 40% 41% 42% 39% Bill Shorten 31% 62% 10% 38% 15% 31% 30% 29% 29% 27% 27% Don’t know 29% 27% 12% 37% 40% 26% 28% 31% 29% 31% 34% - 40% thought that Scott Morrison would make the better Prime Minister (down 4%pts from last month), and 31% thought Bill Shorten would be better (no change from March). 29% did not know who would make a better Prime Minister.
- The results were split by party allegiance, with 78% of Liberal/National voters saying that Scott Morrison would be a better Prime Minister (down 4%pts from March), and 62% of Labor voters saying Bill Shorten would (down 4%pts from 63% in March).
- Greens voters preferred Bill Shorten (38%) to Scott Morrison (25%).
- Both men (47% to 32%) and women (33% to 30%) would prefer Scott Morrison to Bill Shorten as Prime Minister.