The Essential Report Archive Read the latest report
-
Awareness of NAIDOC Week
Q. NAIDOC Week is a national observance starting from the first Sunday in July. NAIDOC Week celebrates the history, culture and achievements of Aboriginal and Torres Strait Islander peoples.
Before today, were you aware of NAIDOC Week?
Total Labor Coalition Greens NET: Other Yes 58% 62% 57% 71% 62% No 34% 32% 38% 21% 35% Don’t know 8% 7% 5% 8% 3% Base (n) 1,097 352 392 97 163 -
Federal voting intention
Q. If a Federal Election was held today to which party will you probably give your first preference vote? If not sure, which party are you currently leaning toward? If don’t know – Well which party are you currently leaning to?
Q Total 1 week ago 2 weeks ago 2016 Election 06/05/19 29/04/19 02/07/16 Liberal 36.2% 36% 36% National 3.6% 2% 4% Total Liberal/National 38.5% 38% 39% 42.0% Labor 36.2% 34% 37% 34.7% Greens 9.1% 12% 9% 10.2% Pauline Hanson’s One Nation 6.6% 7% 6% Other/Independent 9.6% 9% 9% 13.1% 2 party preferred Liberal/National 48.5% 48% 49% 50.4% Labor 51.5% 52% 51% 49.6% - Respondents who select ‘don’t know’ are not included in the results. The two-party preferred estimate is calculated by distributing the votes of the other parties according to their preferences at the 2016 election.
-
Expected Winner
Q. Which party do you expect will win the 2019 Federal election and form Government?
Total Vote Labor Vote Liberal / National Vote Greens NET: Vote Other Last week 06/05/19
Two weeks ago 29/04/19
Labor 59% 92% 29% 75% 55% 54% 59% Liberal/National 41% 8% 71% 25% 45% 46% 41% - Heading into the final week of campaigning, 59% of voters believe Labor will triumph over the Liberal/National coalition in the 2019 Federal election, up 5%pts from last week from 54% and equivalent to the start of the campaign at the end of April.
- 92% of Labor voters are confident that Labor will win on Saturday. Similarly, the majority of Greens voters (75%) and those voting for independents or minor parties (55%) expect a Labor victory.
- Voters for the Coalition expect them to form the next Government following the result on Saturday (71%). This has decreased from 79% last week.
-
Election Engagement
Q. How much attention have you been paying to the news, advertising and updates from the Federal Election?
Total Vote Labor Vote Liberal / National Vote Greens NET: Vote Other Last week 06/05/19
Two weeks ago 29/04/19
Have not been paying any attention 18% 12% 12% 23% 20% 16% 19% Have been paying little attention 28% 31% 26% 33% 29% 29% 29% Have been paying some attention 35% 36% 43% 27% 37% 36% 33% Have been paying a lot of attention 18% 22% 20% 18% 14% 19% 20% Total Aged 18-34 Aged 35-54 Aged 55+ Have not been paying any attention 18% 29% 15% 12% Have been paying little attention 28% 33% 34% 19% Have been paying some attention 35% 26% 35% 43% Have been paying a lot of attention 18% 12% 16% 26% - There has been limited change in the interest shown in the election during the campaign. 18% said they were paying no attention to the election is up 2%pts from last week, but no higher than 19% at the end of April. Younger voters have consistently had the lowest engagement in the election, with 29% paying no attention in the final week.
- However, older voters are so far most engaged with the election, with 26% saying they have been paying a lot of attention.
- Men were more likely than women to say they had been paying a lot of attention to the election (23% to 13%).
-
News Stories
Q. What news stories about the campaign have you noticed?
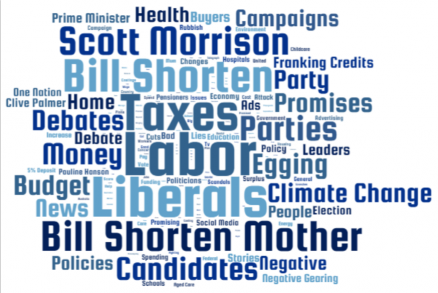
- Two major news stories affecting the party leaders this week were the reaction to the Daily Telegraph’s story on Bill Shorten’s mother, and the egging of Scott Morrison. There was some awareness of the final leaders debate.
- Coalition messaging and advertising appears to be cutting through, as taxes were the most mentioned policy issue. Climate change was a frequently mentioned topic – more so than negative gearing, franking credits or the 5% deposit for first-time homebuyers.
- Following much coverage in previous weeks, UAP, One Nation and their respective leaders have had a relatively quiet week.
-
Preferred Prime Minister
Q. Who do you think would make the better Prime Minister out of Scott Morrison and Bill Shorten?
Total Vote Labor Vote Lib/Nat Vote Greens Vote other May 2019 Apr 2019 Mar 2019 Jan 2019 Dec 2018 Nov 2018 Oct 2018 Scott Morrison 39% 9% 80% 14% 42% 42% 40% 44% 42% 40% 41% 42% Bill Shorten 32% 69% 7% 47% 17% 31% 31% 31% 30% 29% 29% 27% Don’t know 28% 22% 12% 39% 41% 27% 29% 26% 28% 31% 29% 31% - Support for Scott Morrison has dipped this week, 39% believe him to be the better PM (down 3%pts from 41% last week). This is as low a score from the Liberal leader since assumed the position in September 2018.
- Bill Shorten is seen as less preferable than Scott Morrison, with 32% thinking he would make the better PM. However this is his highest score during the tenure of Scott Morrison as PM (up 5%pts from 27% in September 2018) and a 1%pt increase from 31% last week.
- The results were split by party allegiance, with 80% of Liberal/National voters saying that Scott Morrison would be a better Prime Minister (no change from last week), and 69% of Labor voters saying Bill Shorten would (up 6%pts from 63%).
- Younger voters (those aged 18-34) think Bill Shorten would be the better PM (37%) compared to Scott Morrison (29%). Whereas voters aged over 55 would prefer Scott Morrison (49%) over Bill Shorten (29%).
-
2019 Voting Method
Q. Which of the following best describes how you intend to vote at the Federal Election?
Total Vote Labor Vote Liberal / National Vote Greens NET: Vote Other Last week 06/05/19
Two weeks ago 29/04/19
I have already placed my vote 8% 7% 8% 6% 9% – – I will vote at a pre-poll before election day 20% 22% 21% 23% 23% 24% 21% I will vote by post 12% 11% 14% 15% 10% 13% 12% I will vote at a polling station on election day 49% 54% 54% 42% 51% 50% 56% I’m not sure how I will vote 6% 4% 2% 12% 5% 9% 7% I don’t intend to vote 4% 2% 1% 2% 2% 3% 3% I intend to vote informal 0% 0% 0% 0% 0% 1% 1% - 8% say they have already cast their vote in the 2019 Federal Election. Those aged over 55 were the most likely to have already voted (15%), compared to just 3% of those aged 18-34.
- About half (49%) of voters intend to visit a polling station on election day. Pre-polling the second most popular option, with 20% intending to do this before Saturday.
-
Happiness
Q. How happy or unhappy are you with each of the following parts of your personal situation? Average rating (out of 10)
Total Male Female 18-34 35-54 55+ My life overall 6.7 6.7 6.7 6.7 6.3 7.1 My personal/family life 7.1 7.1 7.1 7.0 6.7 7.6 My spiritual life 6.3 6.3 6.4 6.4 6.0 6.6 My social life 6.2 6.3 6.1 6.2 5.8 6.6 My work life 5.3 5.5 5.1 5.4 5.4 5.3 My financial situation 5.2 5.4 5.0 5.1 4.8 5.6 - On Average, Australians rate their happiness with their life overall at 6.7 out of 10. They are most happy with their family/personal life (7.1 out of 10), and least with their work life (5.3 out of 10) and financial situation (5.2 out of 10).
- Overall, those aged over 55 are happier with their life (7.1) than 18-34 year olds (6.7) and 35-54 (6.3). Older Australian more highly rate their happiness with their personal/family life (7.6), social life (6.6) and financial situation (5.6).
- Tasmania is the happiest state in Australia (7.2), but Western Australia has the lowest happiness score of 6.3 out of 10. Western Australians’ happiness scores for personal family life (6.7) and financial situation (4.7) are the lowest in the country.